Mostly summarized from Gregory Mankiw’s Principles of Economics, 5th Ed.
PART 5 Firm Behavior and the Organization of Industry
Chapter
15 of 36 Monopoly
Section
17 of 33
…
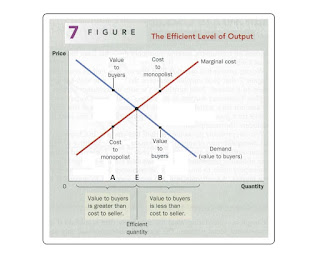
Figure 7 here
…
Figure
7 – The Efficient Level of Output
A benevolent
social planner who wanted to maximize total surplus in the market would choose
the efficient quantity level of output, point E.
This
is where the demand curve and
marginal-cost curve intersect.
At less than
this efficient quantity, point A
· the value of the good to the marginal buyer
· is more than the marginal cost of making the good
At more than
this efficient quantity, point B
· the value of the good to the marginal buyer
· is less than the marginal cost of making the good
…
Consider
what the monopoly firm would do if run by a benevolent social planner.
The
social planner cares about both
·
the profit earned by the firm's owners, with resulting growing economy, more
jobs and higher worker pay
·
the benefits received by the firm's consumers, lower prices and able to buy
more goods
The
planner wants to maximize total surplus
· total
surplus = producer surplus (profit) + consumer surplus (value to consumer in
excess of price paid)
…
Viewing
Figure 7:
The
demand curve shows the value of the good to consumers.
The
marginal-cost curve shows the production costs of the monopoly producer.
The socially efficient quantity is determined where
the demand curve and the marginal cost curve intersect.
…
At
less than the efficient quantity, point A, the value of an extra unit to
consumers exceeds the cost of providing it.
Increasing
output would raise total surplus.
At
more than the efficient quantity, point B, the cost of producing an extra unit
exceeds the value of that unit to consumers.
Decreasing
output would raise total surplus.
At
the optimal quantity E the value of an extra unit to consumers exactly equals
the marginal cost of production.
… …

Comments
Post a Comment