Free Trade Increases Total Surplus … First watch this video Imports, Exports, and Exchange Rates: https://www.youtube.com/watch?v=geoe-6NBy10 … The U.S.A. should unilaterally end all import restrictions. This might seem radical but this is a widely held and promoted stance among libertarians including those at the Cato Institute. Consumer surplus is the price a person is willing to pay in excess of what they actually pay. Producer surplus is the price a producer sells its product for in excess of the cost of production. Total surplus = consumer surplus + producer surplus = total economic gain. For an economy maximizing total surplus is the goal, and it doesn’t matter if consumer surplus or producer surplus is bigger. … In Figure 1: Before country “Hereland” opens up to allow imports, Product X is only supplied to consumers in Hereland by producers located in Hereland: · price of X is $10 · quantity supplied of X is 20 units · consumer surplus is a...
Posts
Showing posts from December, 2021
- Get link
- X
- Other Apps
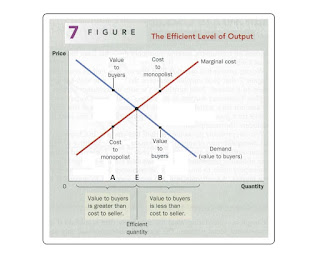
Mostly summarized from Gregory Mankiw’s Principles of Economics, 5 th Ed. PART 5 Firm Behavior and the Organization of Industry Chapter 15 of 36 Monopoly Section 17 of 33 … Figure 7 here … Figure 7 – The Efficient Level of Output A benevolent social planner who wanted to maximize total surplus in the market would choose the efficient quantity level of output, point E. This is where the demand curve and marginal-cost curve intersect. At less than this efficient quantity, point A · the value of the good to the marginal buyer · is more than the marginal cost of making the good At more than this efficient quantity, point B · the value of the good to the marginal buyer · is less than the marginal cost of making the good … Consider what the monopoly firm would do if run by a benevolent social planner. The social planner cares about both · the profit earned by the firm's owners, with resulting grow...
- Get link
- X
- Other Apps
Mostly summarized from Gregory Mankiw’s Principles of Economics, 5 th Ed. PART 5 Firm Behavior and the Organization of Industry Chapter 15 of 36 Monopoly Section 16 of 33 … Figure 5 here … Total Surplus figure here … Per Figure 5 a monopoly firm, unlike a competitive firm, charges a price above marginal cost. For example, it only costs a pharmaceutical company to make $.50 make an additional (marginal) medication pill, but because of its patent giving it a monopoly it can charge $5.00 per pill. For consumers, this high price makes a monopoly undesirable. For the monopoly firm, it is earning profit from this high price, making the monopoly desirable. … The question arises: Do the benefits to the monopoly firm's owners at least equal the costs imposed on consumers making the monopoly desirable for society as a whole? Recall total surplus measures the economic well-being of buyers and se...
- Get link
- X
- Other Apps
Mostly summarized from Gregory Mankiw’s Principles of Economics, 5 th Ed. PART 5 Firm Behavior and the Organization of Industry Chapter 15 of 36 Monopoly Section 15 of 33 … Figure 6 here … Figure 6 - The Market for Drugs When a patent gives a firm a monopoly on the making and sale of a drug the firm charges the monopoly price. This price is well above the marginal cost of making the drug. When the patent on a drug runs out new firms enter the market, making the market more competitive. The price eventually falls from the monopoly price to marginal cost. … Prices are determined differently in monopoly markets and competitive markets. One way to illustrate this is with the market for pharmaceutical drugs. This market has both monopoly and competitive market structures. Patent law gives a firm a monopoly on the sale of a new drug it develops. Eventually the monopoly firm's patent expires, then any company can make and sell the drug. The market chang...
- Get link
- X
- Other Apps
Mostly summarized from Gregory Mankiw’s Principles of Economics, 5 th Ed. PART 5 Firm Behavior and the Organization of Industry Chapter 15 of 36 Monopoly Section 14 of 34 … Figure 5 here … A monopoly firm does not have a supply curve. We have analyzed the price in a monopoly market using the market demand curve and the firm's cost curves. A supply curve tells us the quantity firms will supply at any given price. This is true when analyzing competitive firms which are price takers and must accept the market price. But a monopoly firm is a price maker not a price taker, it can decide what price to charge. … We cannot ask what quantity a monopoly firm would produce a certain price because the monopoly sets the quantity supplied and price. This price and quantity point is where profit is maximized. In Figure 5 this is at monopoly price and QMAX. The shape and slope of the monopolist’s demand curve det...
- Get link
- X
- Other Apps
Mostly summarized from Gregory Mankiw’s Principles of Economics, 5 th Ed. PART 5 Firm Behavior and the Organization of Industry Chapter 15 of 36 Monopoly Section 12 of 32 … Figure 5 here … Figure 5 - The Monopolist's Profit The area of the box BCDE equals the profit of the monopoly firm. BC the height of the box is price minus average total cost which equals profit per unit sold. DC the width of the box is the number of units sold. … Abbreviations: Total Revenue TR Total Cost TC Average Total Cost ATC Quantity of units produced Q Price P … Total profit = TR – TC Price per unit = average revenue = TR / Q Cost per unit = ATC = TC / Q Total profit = (P - ATC) x Q … …
- Get link
- X
- Other Apps
Mostly summarized from Gregory Mankiw’s Principles of Economics, 5 th Ed. PART 5 Firm Behavior and the Organization of Industry Chapter 15 of 36 Monopoly Section 12 of 34 … Chapter 14 Figure 1 here … Figure 4 here … Per Figure 4, to maximize profit, the monopoly firm adjusts its level of production until the quantity reaches QMAX, where marginal revenue equals marginal cost. The monopoly’s profit maximizing quantity of output is determined by the intersection of the marginal revenue curve and the marginal cost curve. This occurs at point A. … Competitive firms also choose the quantity of output at which marginal revenue equals marginal cost, point A on Figure 1. The rule of where marginal revenue equals marginal cost for profit maximization applies to both competitive and monopoly firms. Any company · makes more unit if the additional (marginal) revenue is more than the additional ...
- Get link
- X
- Other Apps
Mostly summarized from Gregory Mankiw’s Principles of Economics, 5 th Ed. PART 5 Firm Behavior and the Organization of Industry Chapter 15 of 36 Monopoly Section 11 of 34 … Figure 4 here … Figure 4 - Profit Maximization for a Monopoly A monopoly firm maximizes profit by choosing the quantity of output at which marginal revenue equals marginal cost, point A. … Looking at Figure 4, at first the monopoly firm is producing at a low level of output, Q1. Here , marginal cost (MC) is less than marginal revenue (MR). If production is increased by 1 unit, the additional revenue would exceed the additional costs, because MR is still above MC, and profit would rise. Always when MC is less than MR a firm can increase profit by producing more units. … Conversely at high levels of output, such as Q2, MC is greater than MR. If the firm reduces production by 1 unit the costs saved would exceed the revenue l...
- Get link
- X
- Other Apps
Mostly summarized from Gregory Mankiw’s Principles of Economics, 5 th Ed. PART 5 Firm Behavior and the Organization of Industry Chapter 15 of 36 Monopoly Section 10 of 34 … Table 1 here … Figure 3 here … Figure 3 – Demand and Marginal Revenue Curves for a Monopoly The demand curve shows how the quantity affects the price of the good. The marginal revenue curve shows how much a monopoly firm's revenue changes when the quantity increases by each extra 1 unit sold. Because the price on all units sold must fall if the monopoly increases production, marginal revenue is always less than the price. … Figure 3 graphs the demand curve and the marginal revenue curve for a monopoly firm. This figure uses the data of Table 1. The demand curve is also the average revenue curve, average revenue equals price. These two curves start at the same point on the vertical axis, because the marginal revenue of...